Meshtastic Range Test: Map Your Mesh Coverage
Measure and map Meshtastic coverage with the range test module, trace route, signal metrics, and MeshMapper. Field tips for flat-plains deployments.

You set up your Meshtastic mesh. Nodes are online. Messages are flowing. But how far does your mesh actually reach? Where are the dead zones? Is that new antenna actually better?
The built-in range test module handles most situations. MeshMapper is worth the extra setup when you want a real coverage map. Here’s how to use everything available.
We’ve run range tests across North Dakota for the better part of a year. What’s below is the workflow we actually use, with the tools in order of how often we reach for them.
Why Range Testing Matters
Range testing isn’t about bragging rights. Dead zone maps tell you where to put the next router. Before-and-after signal data tells you whether that antenna upgrade was worth the money. Trace routes tell you whether your routers are actually doing anything useful.
LoRa on the North Dakota plains performs differently than in mountains or cities. Testing in your actual deployment area is the only way to know what you’re working with.
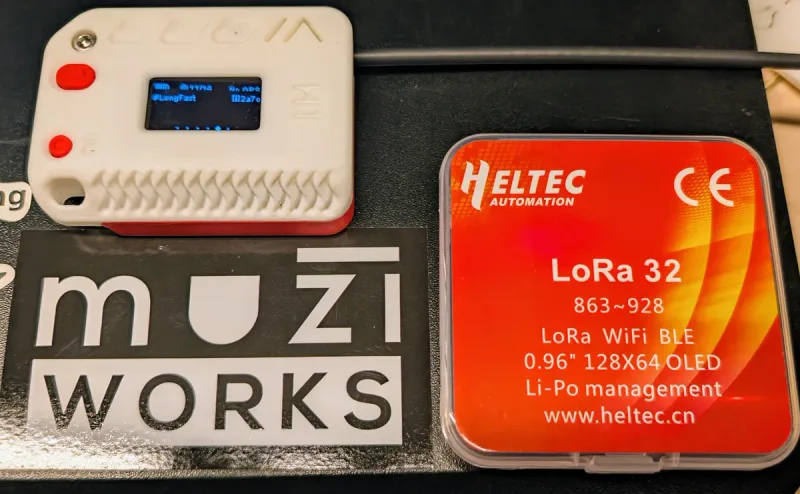
Tool 1: Built-In Range Test Module
The simplest way to test range. One node sends periodic messages while you walk, drive, or bike with another node. The receiving node logs signal quality and GPS position for each packet.
How to set it up
Sender node (stays in one place):
meshtastic --set range_test.enabled true
meshtastic --set range_test.sender 30
This sends a range test packet every 30 seconds. Adjust the interval as needed. Shorter intervals give more data points but use more airtime.
Receiver node (the one you carry):
No special configuration needed. The receiver logs range test packets automatically. Make sure GPS is enabled on both nodes so distance calculations are accurate.
Via the app
- Go to Settings > Modules > Range Test
- Enable Range Test
- Set Sender interval (seconds)
- On the sender, enable “Sender” mode
- The receiver logs data automatically
Reading the results
The range test logs show:
- Distance between sender and receiver (requires GPS on both)
- SNR (Signal-to-Noise Ratio). The most meaningful LoRa metric.
- RSSI (Received Signal Strength Indicator)
- Packet success or failure. Did the message arrive?
What good numbers look like:
| Metric | Excellent | Good | Marginal | Likely Failure |
|---|---|---|---|---|
| SNR | > +10 dB | +5 to +10 | 0 to +5 | < -5 dB |
| RSSI | > -90 dBm | -90 to -110 | -110 to -120 | < -125 dBm |
LoRa can decode signals well below the noise floor, which is why SNR matters more than RSSI. A packet with SNR +5 dB at RSSI -120 dBm will decode fine.
Tips for good data
Keep the sender in a fixed spot with a known-good antenna. Make sure GPS is enabled on both nodes or your distance numbers will be garbage. If you can, disable other traffic during testing or run range tests on a dedicated channel so you’re not measuring noise from normal mesh chatter. Atmospheric conditions do affect LoRa. If you get wildly different results on different days, that’s probably why.
Tool 2: Trace Route
Trace route shows the exact path a message takes through your mesh. Like traceroute in networking but for LoRa.
How to use it
Via CLI:
meshtastic --traceroute !nodeIdReplace !nodeId with the target node’s ID (visible in the node list).
Via the app:
- Open the node list
- Long-press on a node
- Select “Trace Route”
What it tells you
The response shows each hop in the path:
Route to !abcdef01:
  > !12345678 (SNR: 8.5, RSSI: -95)
  > !87654321 (SNR: 4.2, RSSI: -108)
  > !abcdef01 (SNR: 6.1, RSSI: -102)
This tells you:
- Which routers are being used. Are messages flowing through your infrastructure?
- Where the weakest link is. The hop with the lowest SNR is your bottleneck.
- Whether the path is optimal. Sometimes traffic takes a longer path than expected.
Trace route for infrastructure planning
Run trace routes from multiple locations to understand your mesh topology. If messages consistently bypass a router, that router might be poorly placed or have a bad antenna. If messages take unnecessarily long paths, you might need a router in between.
Tool 3: Signal Metrics in the Node List
Every Meshtastic node maintains a list of discovered nodes with real-time signal data. This is the easiest way to quickly check signal quality without running a formal test.
What to look at
In the app’s node list, tap any node to see:
- SNR. Signal quality for the last received packet.
- RSSI. Signal strength for the last received packet.
- Hops. How many relays the message went through.
- Last Heard. When the node was last active.
- Distance. Calculated from GPS positions (if both nodes have GPS).
- Battery. Remote node’s battery percentage.
Via CLI
meshtastic --nodesThis prints a table of all discovered nodes with their signal data.
Tool 4: MeshMapper (Wardriving)
MeshMapper is an Android app that records GPS and signal data as you move, then visualizes your mesh coverage on a map. Wardriving for mesh networks.
How it works
- Install MeshMapper on your Android phone
- Connect to your Meshtastic device via Bluetooth
- Drive, walk, or bike through the area you want to map
- MeshMapper logs GPS position and signal quality for every received packet
- Upload the data to generate a coverage heatmap
What you get
A color-coded map showing signal quality across your area:
- Green zones. Strong signal, reliable communication.
- Yellow zones. Marginal signal, messages usually get through.
- Red zones. Weak signal, high packet loss.
- No coverage. No packets received.
Tips for good coverage maps
- Drive a systematic grid pattern rather than random routes
- Cover the edges of your expected coverage area, not just the center
- Map at different times if you suspect time-of-day effects
- Document your antenna and power settings so maps are reproducible
Tool 5: MQTT-Based Monitoring
For continuous monitoring without manual testing, use MQTT. Nodes with Wi-Fi publish telemetry data to an MQTT broker, which can feed into Grafana dashboards for long-term trend analysis.
What MQTT monitoring shows
- Node uptime. When nodes come online and go offline.
- Battery trends. Charging cycles and degradation over time.
- Signal quality over time. Does performance change with weather or seasons?
- Traffic patterns. When is your mesh busiest?
- Channel utilization. How much airtime is being used.
See our MQTT setup guide for step-by-step instructions.
Maximizing Range in North Dakota
LoRa on flat terrain is mostly in your favor, with some catches.
The good: flat ground means long line-of-sight. 10+ mile links are achievable with modest antennas. Low population density means less radio interference. And grain elevators (the tallest structures in many small towns) make excellent router locations if you can get permission.
The catches: winter kills batteries (see our repeater setup guide for cold weather tips), trees and terrain rolls still block signals at low heights even on “flat” ground, and towns are far enough apart that bridging them usually requires at least one high-elevation router.
Practical tips
- Height is everything. Even 20 feet of elevation gain dramatically improves range on flat terrain. Roof mounts, grain bins, and water towers are your friends.
- Use a proper external antenna. Stock antennas are designed for portability, not range. A $15 fiberglass antenna on a roof beats a stock antenna at ground level every time.
- Test before you deploy permanently. Do a range test from your planned router location before mounting hardware. A bad location is a bad location no matter how good the antenna.
- Verify with a NanoVNA. Cheap antennas can be poorly tuned. A NanoVNA lets you verify SWR at 915 MHz before deploying. See our NanoVNA antenna testing guide.
Putting It All Together
A practical range testing workflow:
- Start with the node list. Check signal quality to nearby nodes. This takes 30 seconds and tells you if your basic setup is working.
- Run trace routes to important nodes. See if traffic is flowing through your infrastructure as expected.
- Use range test module for targeted testing. New antenna, new location, new router placement. Compare before and after.
- Map coverage with MeshMapper when you need a comprehensive picture of your mesh footprint.
- Set up MQTT monitoring for ongoing health tracking once your mesh is deployed.
Realistically, you’ll use the node list 90% of the time. Break out MeshMapper when you’re deciding where to put a new router.
Related Guides
- Meshtastic Network Analyzer. All analysis tools in one place.
- Router and Repeater Setup. Deploy infrastructure based on your test results.
- Antennas. Antenna recommendations for maximum range.
- NanoVNA Antenna Testing. Verify antenna performance before deploying.
- Meshtastic MQTT Setup. Set up continuous monitoring via MQTT.
- CLI Guide. All CLI commands for testing and diagnostics.
Comments
Related Posts
Seeed MeshCore Starter Kit: Solar Repeater + Client Bundle
Seeed's MeshCore Starter Kit bundles a solar repeater and Wio Tracker L1 Pro into one off-grid mesh. Antenna picks, setup tips, and who it's for.

MeshCore Path Hash Modes Explained: 1, 2, and 3 Byte
How MeshCore's 1, 2, and 3 byte path hashes work, why 1-byte collides at scale, and when to switch. Guide to path.hash.mode for growing meshes.

Meshtastic MQTT Setup: Bridge Your Mesh to the Internet
Set up MQTT on Meshtastic to bridge your LoRa mesh to the internet. Uplink/downlink, public vs self-hosted broker, Home Assistant, Grafana.